
Application performance is more important than ever since COVID-19. More business are going digital, and customers are spoilt for choice online. If your website is slow or laggy, chances are your customers won’t stay long. Don’t just take my word for it, here’s some hard research.
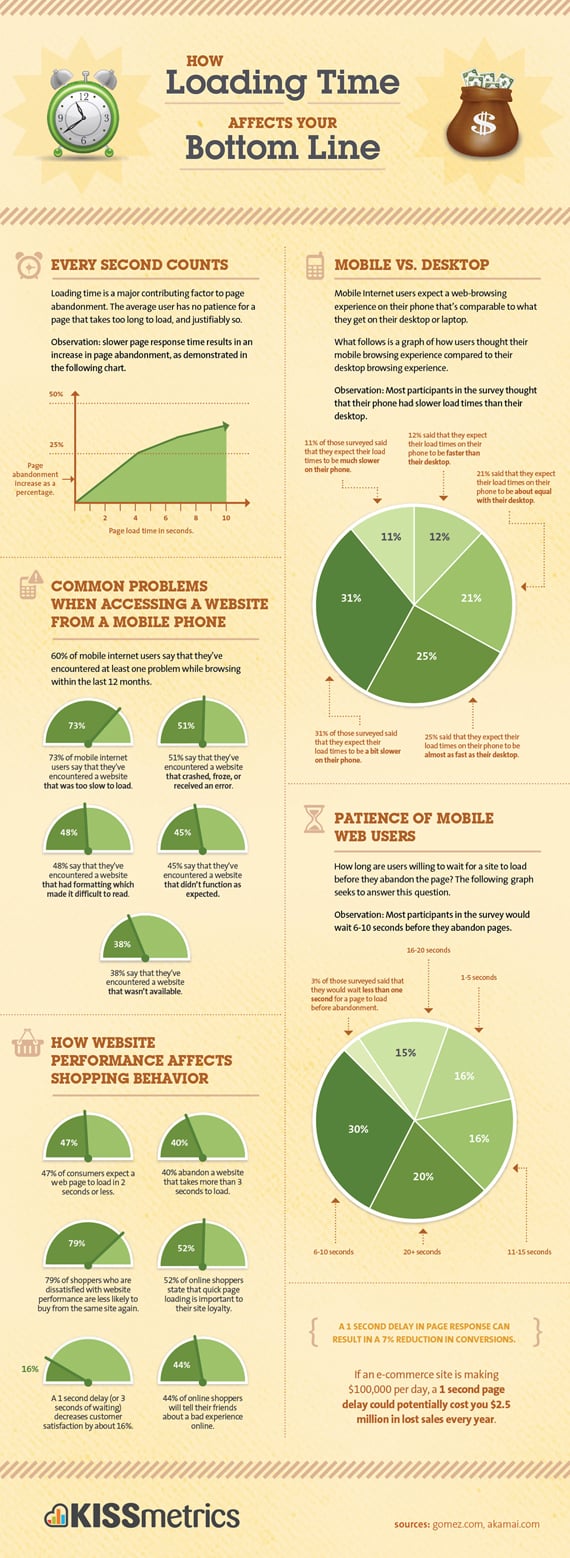
- Even a 1% delay in page load can cause a 7% drop in conversions
- 40% of people abandon a website that takes more than 3 seconds to load
- 35% of customers will be less likely to purchase your products or services if your website performance is poor
Given our loss in patience and the reduction in switching costs, users no longer hesitate to jump to another competitor when they have poor, slow experiences. But what would be the best metrics to measure? Where do you get started? This article aims to address these questions, so you can get the best picture of your website’s performance to identify bottlenecks and fix them.
Before you get started
Before you start thinking about the KPIs to measure your performance, it’s important to have a clear idea about what your goals are, and pick a performance testing tool. Some common performance goals for your website could be:
- Determine responsiveness, stability and reliability of system under load
- Ensure system meets SLAs
- Determine system capacity
- Ensure scalability of the systems to handle growing workload
- Identify and diagnose performance bottlenecks
Once you figure out what your goals are, you can then start to figure out what metrics to track. From here, you need to pick a good load testing tool. There’s two types of load testing platforms for web applications – browser-based load testing solutions or protocol based solutions.
Protocol-based load testing solutions
Protocol-based load testing tools have been around since the early 90s. Traditional load testing is done on the protocol level by sending HTTP or other types of protocol requests directly to the web server. These requests are sent without simulating the application interface, and the responses that are received from the server are not visualized, either. Since the test scripts in protocol tools capture HTTP transactions, any dynamic components in these transactions like session IDs and cookies need to be manually correlated and programmed before running them in a load test. This process, while strenuous and time consuming, creates resilient tests. JMeter, LoadRunner and Gatling are popular examples.
Browser-based load testing solutions
Browser-based solutions drive the browser to simulate end user actions, and generate load using real browsers, typically in headless mode. Because the browser is automated to perform end user actions, there is no requirement to program and correlate any dynamic components, making it great for agile load testing. LoadNinja and TruClient are popular examples.
The best performance metrics to analyze
Performance metrics are used to calculate performance parameters and identify leading and lagging indicators to measure against performance goals. Lagging indicators are typically “output” oriented, easy to measure but hard to improve or influence while leading indicators are typically input oriented, hard to measure and easy to influence.
To understand the best metrics to measure, let’s look at how a web transaction takes place. Computers connected to the web are called clients and servers.
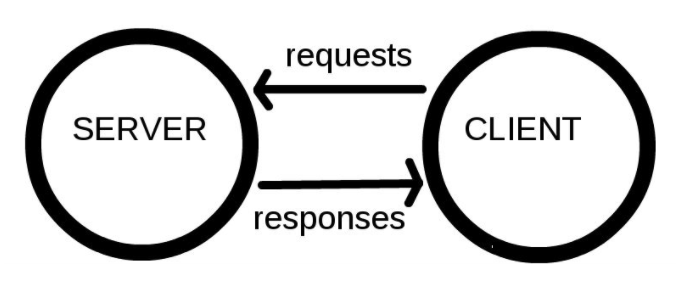
- Clients are the user’s portal to the WWW. For example, your internet browser on computer connected to your Wi-Fi
- Servers are computers that store webpages, sites, or apps. When a client device wants to access a webpage, a copy of the webpage is downloaded from the server onto the client machine to be displayed in the user’s web browser.
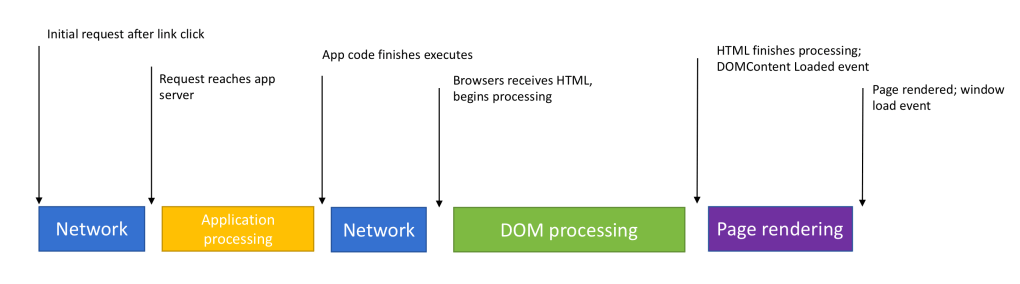
Look at the above image from left to right. Lets say a user navigates to a website on a browser on their phone.
Network metrics
The request, from the client, for the website, first needs to go past a DNS lookup, where the DNS server associates a website name to the right IP address of the web application server. When a DNS lookup is successful, a connection is made with the application server that contains the code base.
Good performance metrics in this journey of the request are:
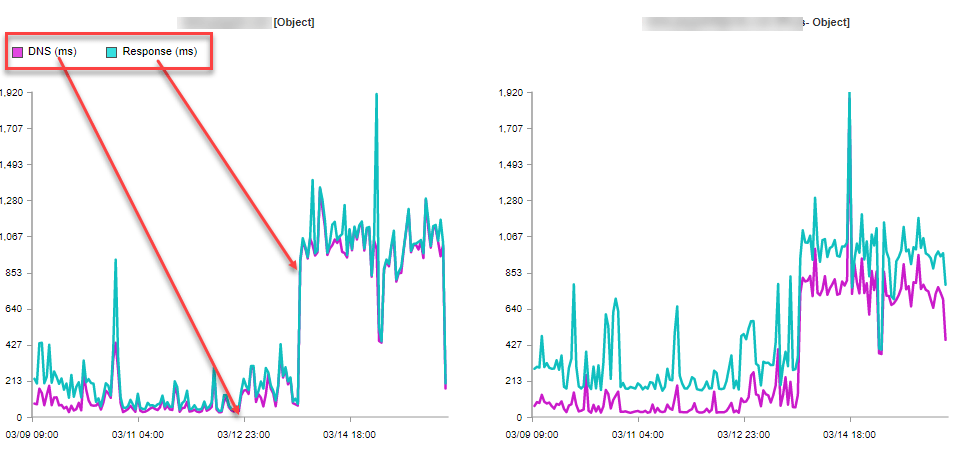
DNS Time: The time spent performing a DNS lookup, that is, obtaining the IP address of the website from a DNS server. If the value is high, it indicates problems with reaching the DNS server and retrieving its response or poor network configuration.
Connect time: The time spent establishing a connection to a web server after the DNS lookup. If value is high, it indicates possible network and routing problems, bad configuration or low efficiency of the server bandwidth.
Application server metrics
From here, the request goes to the application server where the associated application code gets executed. Some metrics in this phase of the journey
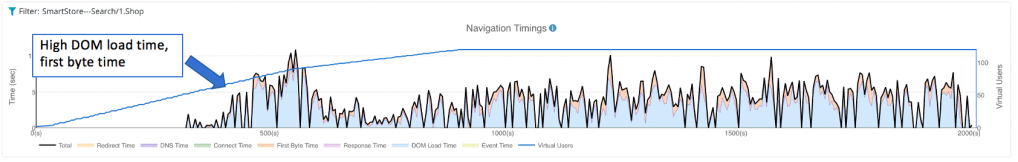
Time to first byte: The time spent waiting for the first byte of the response from the server. Includes processing the requests, accessing the database of the server, selecting and generating the response.
Response time: The total time passed from the moment when the client sent the composed request until the moment when the page’s HTML code got downloaded.
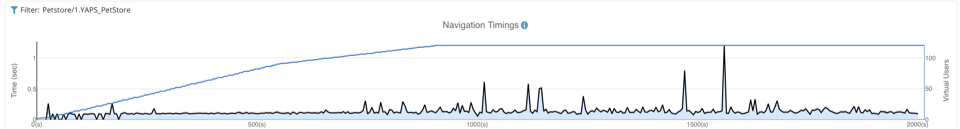
If response time or time to first byte values are high, it could indicate high server load, problems with database queries, bloated web pages, or memory leaks. It could also indicate a lack of efficient caching. Caching is a crucial step in delivering content faster to users. However, the lack of it creates unnecessary waiting periods due to the fact that the browser must request assets from the server every time instead of accessing them from a local or intermediary cache.
Throughput (TPS): Simultaneous request/transactions per second/minute application can handle. The TPS can correlate with response times if requests are sequential/consequent. Longer response time = lower the TPS. Very low throughput could indicate that your site was failing to respond before requests were timed out, or that many of your resources were treated as cached if the continue to appear on each page which is good.
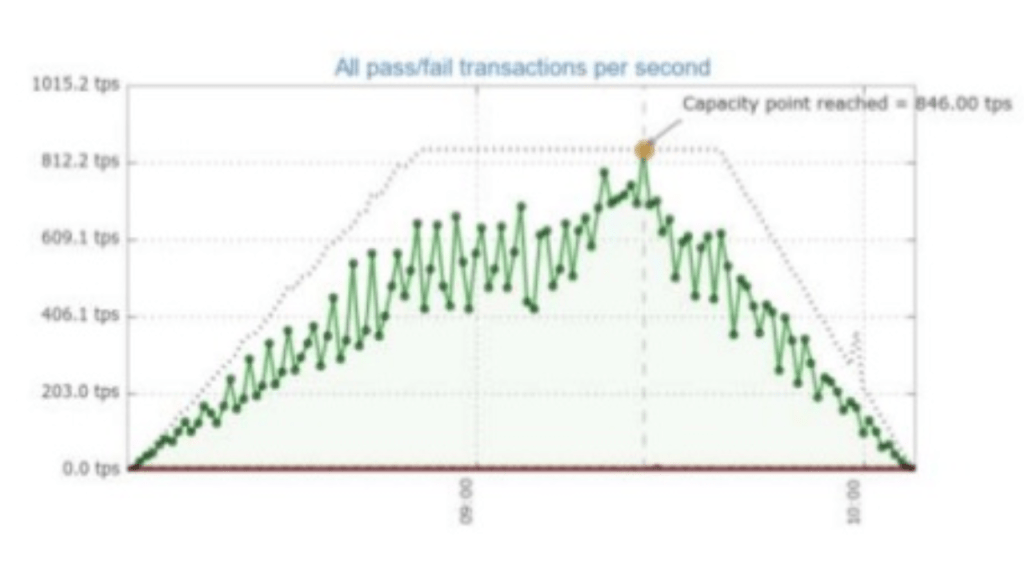
Error rate: The HTTP status codes, specifically errors (4xx, 5xx) generated per minute. Tells how many failed requests are occurring at a particular point in time of your load test.
Processor Usage : The amount of time processor spends executing non-idle threads.
Memory use : The amount of physical memory available to processes on a computer.
Disk time : The amount of time disk is busy executing a read or write request
Client-side metrics
Once the response is received by the client, it starts to process and construct the page. This is where you can analyze some client side metrics, like –
DOM load time: The total time it took to load and construct the DOM. The DOM is considered completed when the DOMContentLoaded event starts.
The CSS, scripts, and other resources the page refers to may still be loading at this point.
OnLoad Time: The time when the HTML document is fully parsed and rendered, including scripts and stylesheets. If these values are elevated, it indicates heavy client-side resources, inefficient asynchronous calls, or juts in efficient CDNs.
Closing notes
There’s a myriad of metrics you could use to understand your web application’s performance. Performance testing is part science, part art. It’s not hard, and and it just takes some creativity to figure out what KPIs make the most sense to isolate performance bottlenecks and ensure a great customer experience when surfing your website.
